1. Density of Starbucks
Worth: 5%
DUE: Monday May 11, 2026 at 11:55pm; submitted on MOODLE.
Files:
asn1.ipynb/asn1.pyandstarbucks2018.csv
1.1. Task
You will write a program that will calculate the density of Starbucks locations within a specified area based on real data of Starbucks locations (as of 2018). You will have to work with some existing code that is provided to you, and you will need to write your own functions to ultimately complete the assignment. You will
Use a provided function to load data into your program
Write a function to convert latitude/longitude units from degrees, minutes, and seconds to decimal
Write a function to calculate the surface area of a sphere as defined by latitudes and longitudes
Write a function to count the number of Starbucks contained within an area defined by latitudes and longitudes
Write a function to calculate the density of Starbucks within an area
Warning
Expect this assignment to take several hours spread across multiple sessions. Getting stuck, backtracking, and trying again is a normal part of the process.
1.2. Provided Files
You are provided with
A notebook file called
asn1.ipynbcontaining the starting point of the assignmentThis file is to be uploaded to Google Colab
Alternatively, if you prefer to complete the assignment with an IDE on your own computer, you may download and use the
asn1.pyfile
The data file called
starbucks2018.csvcontaining latitude and longitude pairs of Starbucks locations
Warning
Do not alter the function details in the provided .ipynb/.py files
Do not change the name of the functions
Do not remove the function description
Do not remove or add to the parameter list
1.3. Part 0 — Read the Assignment
Read the assignment description in its entirety before starting.
1.4. Part 1 — Uploading Files to Colab
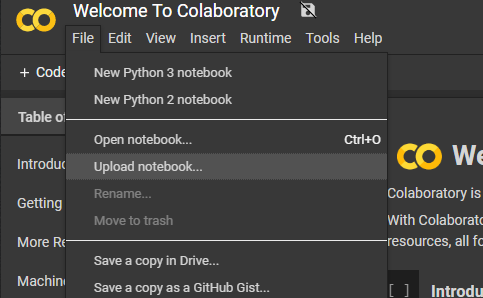
After downloading the notebook file above, you will need to upload it to Colab to get started. See the below image to help find how to do this. Saving a copy to your Google Drive and working from that is recommended — otherwise you will need to re-upload it each time you open Colab.
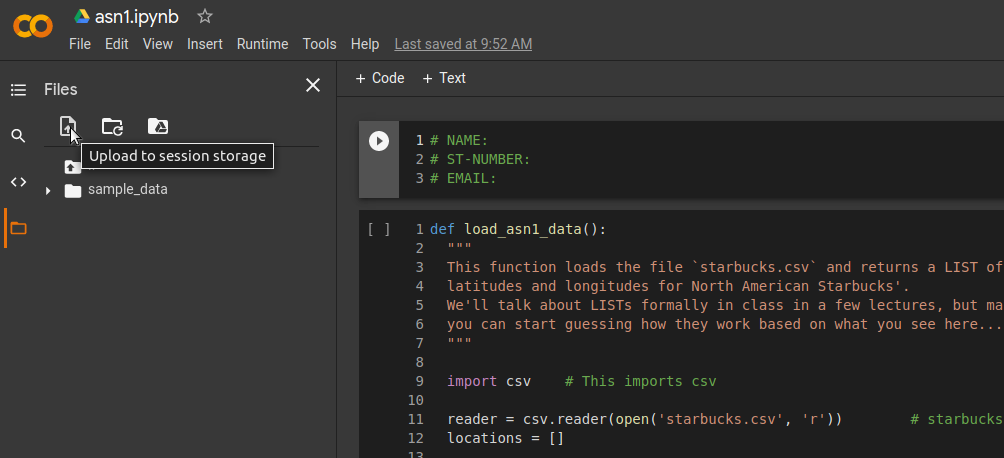
Additionally, you will need to upload the Starbucks location data file to Colab. The way you upload a data file like this is different from uploading the notebook file. See the below image for an example of how to upload this file. Unfortunately, you must re-upload this data file every time you open your Colab project. Not a big deal, but something you will need to remember.
1.5. Part 2 — Read Over Loading Function
The function that loads the data, load_starbucks_data, is already provided for you. It contains ideas we have yet to
discuss in class, but it shouldn’t be too difficult to get an intuition about what exactly it is doing if you look over
it and play with it a little.
Reading code you didn’t write and making sense of unfamiliar ideas is something programmers do constantly — this is good practice.
Warning
For the loading function to work, the .csv file must be in the same directory as your Python script. This means
in your Colab project (see Part 1). If it is not, this function will not work and you will see an error message
like No such file or directory: 'starbucks2018.csv'.
1.6. Part 3 — Degrees to Decimal
Humans like to express latitudes and longitudes in degrees, minutes, and seconds. You could work with those units in Python, but your computations (and, hence, code) will be much cleaner and easier to follow if you convert the data into the single unit “degrees”, using decimals of a degree to represent “arcminutes” (1/60th of a degree) and “arcseconds” (1/60th of an arcminute).
Complete the function convert_degrees_to_decimal such that it converts the provided degrees, arcminutes, and
arcseconds to decimal. The parameters are a latitude/longitude in degrees, arcminutes, and arcseconds. The function
should return the same latitude/longitude as a single value in decimal degrees (a single value of type float).
If you are not familiar with the conversion, check Wikipedia.
If you look at the data file, you will notice that the data is already stored as a decimal. This means you do not actually need to use this function to convert the data from the Starbucks location file.
1.7. Part 4 — Subtended Area
Since we want to calculate the density of Starbucks, we need to consider the units used. A reasonable measure would be
Starbucks per square kilometers. In order to compute this, we must first calculate the area of the “rectangle” defined
by two latitude and two longitudes. You are to complete the function subtended_area that takes four parameters. Two
latitudes defining the top and bottom of the “rectangle” and two longitudes defining the sides of the “rectangle”. The
function will return the area of the “rectangle” in kilometers squared (\(km^{2}\)).
However, in reality, since it is a sphere that the surface area is being calculated on, the latitude and longitudes do not actually define a rectangle we are familiar with. This means that the simple \(length * height\) will not work. Instead we need to calculate it with the following equation.
\(\frac{\pi}{180} \cdot R^{2} \cdot \lvert sin(lat_{1}) - sin(lat_{2}) \rvert \cdot \lvert lon_{1} - lon_{2} \rvert\)
In our case we will use \(R = 6371\) for Earth, which is stored in the provided file as the constant
EARTH_RADIUS.
Warning
Do Python’s trig functions (eg., math.sin) expect parameters in degrees or radians?
Read the relevant documentation to find out.
1.8. Part 5 — Counting Starbucks
In order to calculate the density of Starbucks, the number of Starbucks within the specified area needs to be known. With the data available, the way to do this is to check each Starbucks’ latitude & longitude and see if it falls within the specified “rectangle”. In other words, check if the Starbucks’ latitude falls between the “rectangle’s” latitudes and if the longitude falls between the “rectangle’s” longitudes. See the below image for an example.
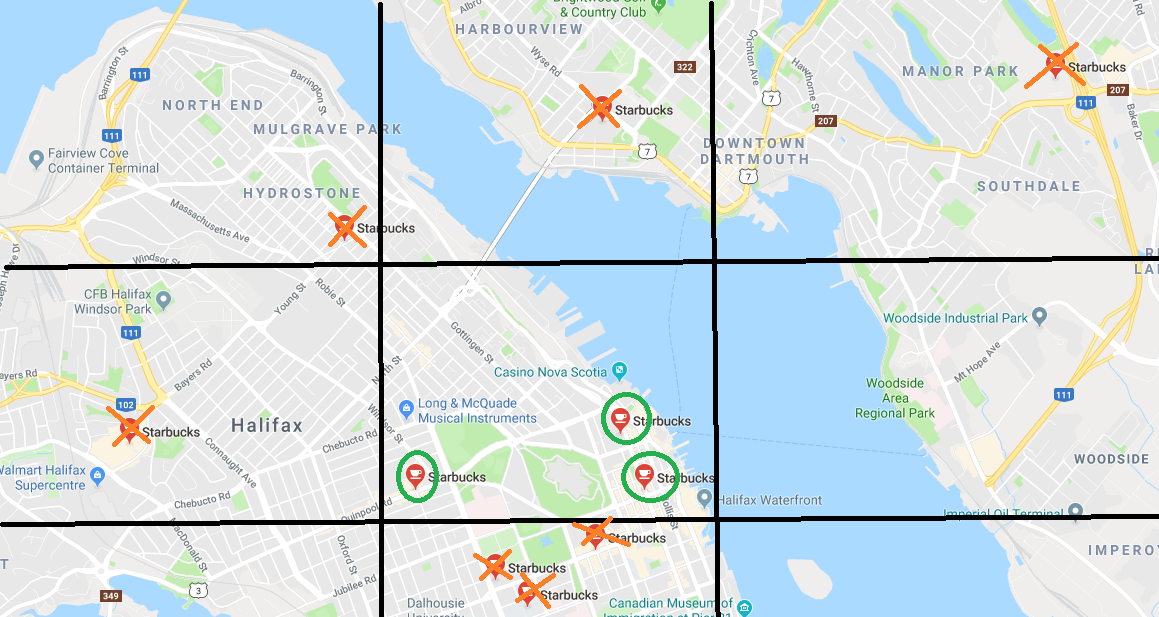
For the purpose of this assignment, only count Starbucks if they are strictly between the specified latitudes and longitudes; don’t count them if they fall on any of the latitude/longitude lines. In other words, when checking if the location is within the rectangle, use greater than/less than instead of greater than or equal to/less than or equal to.
The function number_starbucks_within_area() takes the list of Starbucks locations and the latitude and longitudes
specifying the “rectangle” as parameters. For simplicity, assume latitude_line_1 < latitude_line_2 and
longitude_line_1 < longitude_line_2. The function is already set up to loop over every Starbucks location in a
list. Have a look at the loop — even if we haven’t formally discussed this in class, there is a good chance you can
make sense of what it’s doing.
You are to complete the body of the loop. Each time through the loop, we’ll be considering a new Starbucks location. The
existing code already stores the current Starbucks location’s latitude and longitude values in their respective
variables. You are to figure out if this specific location falls within the area defined by the latitudes and longitudes
passed to the function as parameters. If the location is within the area, we count it, otherwise, we do not. Keep track
of the running total of Starbucks within the area and, when the loop is finished checking each Starbucks
location, the function will return the final count.
1.9. Part 6 — Calculate Starbucks Density
Complete the starbucks_per_square_kilometer function that, given a file name and the latitude and longitudes to
define a “rectangle”, calculates and returns the density of Starbucks within that “rectangle”.
Below is some pseudocode of what this function is to do.
Load the data
Calculate the area of the "rectangle"
Count the number of Starbucks within the "rectangle"
Calculate the density of Starbucks within the "rectangle" --- divide the number of Starbucks by the area
Return the density
1.10. Part 7 — Using Your Function
Play around with the starbucks_per_square_kilometer function. Try some small “rectangles” and big ones. What area
has the highest Starbucks density you can find? The lowest?
After playing with the function a little, record within a text file the smallest and largest densities you found and what the parameters were that you used to get the densities. You do not need to find the largest or smallest possible densities — simply try a few parameters and see what you get.
1.11. Part 8 — Testing
To help ensure that your program is correct, run the provided assertion tests. Each function is followed by a series of
commented out assertion tests that will help you test your code. When you are ready to test your functions, simply make
them not comments (remove the #) to include them in your running program. There is no guarantee that if your code
passes all the tests that you will be correct, but it certainly helps provide peace of mind that things are working as
they should.
Run the tests as you complete each part, not all at once at the end. One of the nice things about programming is that you can check your work as you go — you don’t have to wait for it to be marked to know if something is working.
1.12. Some Hints
Work on one function at a time
Get each function working perfectly before you go on to the next one
Test each function as you write it
This is a really nice thing about programming; you can call your functions and see what result gets returned
Mentally test before you even write — what does this function do? What problem is it solving?
If you need help, ask
Drop by office hours
1.13. Some Marking Details
Warning
Just because your program produces the correct output, that does not necessarily mean that you will get perfect, or even that your program is correct.
Below is a list of both quantitative and qualitative things we will look for:
Correctness?
Did you follow instructions?
Comments?
Variable Names?
Style?
Does the code make sense?
1.14. What to Submit to Moodle
Make sure your NAME and STUDENT NUMBER appear in a comment at the top of the program
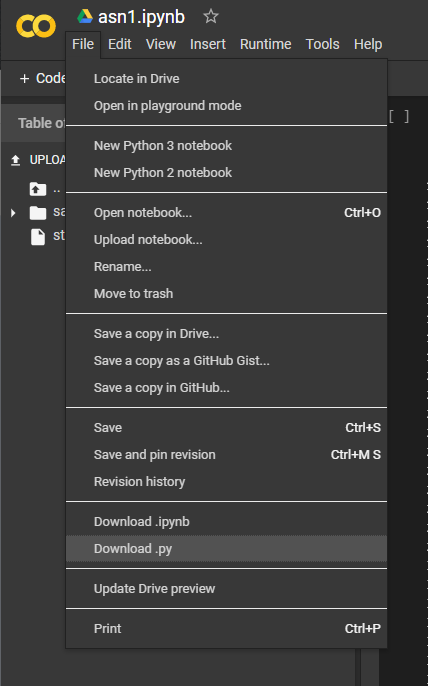
Submit your version of
asn1.pyto MoodleDo not submit the .ipynb file
To get the
asn1.pyfile from Colab, see the image below
Also submit your text file describing the areas you found with the highest, and lowest, Starbucks densities and a short description of how you found them
Don’t worry about finding the highest or lowest density values, just try a few and pick your highest and lowest
Warning
Verify that your submission to Moodle worked. If you submit incorrectly, you will get a 0.
1.15. Assignment FAQ
Why does python keep saying
No such file or directory: 'starbucks2018.csv'?This means Python can’t find the file it needs
Ensure you actually uploaded the file to Colab correctly
I never used the
convert_degrees_to_decimalfunction, is that OK?That is correct
Although you do not need to use the function to calculate the density, one may want to add additional locations
The degree values do not specify a cardinal direction; how do I deal with cardinal directions?
Although a N/S or E/W direction is not included, positive and negative values are used to change hemispheres
I keep getting a density value of 0, no matter what I do, why?
Check that you are not selecting an area over an ocean or desert
Ensure your parameters are ordered such that the lower latitude/longitude values are first
Did I provide enough detail in my text file?
Probably
The shorter the better
The marker just wants to see that you played around a little to find some density values
Are the high and low density values I found OK?
It does not matter how high or low they are
Simply try a few areas to see what you get