2. Zombie Infections
Worth: 5%
DUE: Monday May 25, 2026 at 11:55pm; submitted on MOODLE.
Files:
asn2.ipynb/asn2.py
Note
For this assignment, you will need to use special Python packages (networkx, matplotlib). The good news is that if you are using Colab you do not need to do anything special. If, however, you are using a local Python interpreter, you may need to install the packages yourself.
2.1. Task
If you can simulate something accurately, it becomes possible to study the simulation without having to actually implement the real thing. You will write a program to simulate a zombie apocalypse scenario on a randomly generated network of cities. Additionally, you will be using your simulation to analyze the spread of the zombie apocalypse throughout your network of cities.
You will
Write a function to check if a city is infected
Write a function to find a given city’s neighbouring cities
Write functions to infect and cure specific cities
Write a function to count the number of cities currently infected
Write functions to simulate the spread of the zombie apocalypse
Run simulations of the zombie apocalypse
Analyze the results of your simulations
2.2. Provided Files
You are provided with
A notebook file called
asn2.ipynbcontaining the starting point of the assignmentThis file is to be uploaded to Google Colab
Alternatively, if you prefer to complete the assignment with an IDE on your own computer, you may download and use the
asn2.pyfile
Warning
Do not alter the function details in the provided .ipynb/.py files
Do not change the name of the functions
Do not remove the function description
Do not remove or add to the parameter list
2.3. Part 0 — Read the Assignment
Read the assignment description in its entirety before starting.
2.3.1. City Data Structure
Every city in the simulation is represented as a list [name, infected, [neighbours]].
nameis a string with the name of the cityinfectedis abool—Trueif the city is infected with zombies,Falseotherwise[neighbours]is a list containing the city numbers (indexes) of the cities connected to this city
For example, a city named "City 0" that is not infected and three neighbours: cities with indices 3, 6, and
7, would be represented as ["City 0", False, [3, 6, 7]].
The world is made up of multiple cities, which are also stored in a list. Therefore, a world with cities 0, 1, 2, …
would be represented as [city0, city1, city2, ...], where city0 would be a stand in for a whole city data
structure. If we were to expand out the city data structures in the above example, we could visualize the data as
[["City 0", False, [3, 6, 7]], ["City 1", False, [0, 6, 8, 9]], ["City 2", False, [3, 6]], ...]
2.4. Part 1 — Uploading Files to Colab
After downloading the notebook file above, you will need to upload it to Colab to get started. See the respective section from assignment 1 for an example on how to do this. Saving a copy to your Google Drive and working from that is recommended — otherwise you will need to re-upload it each time you open Colab.
2.5. Part 2 — Read Over Provided Code
There are many functions already completed within the assignment 2 notebook file. These functions provide important functionality for the assignment. They contain ideas that you are likely not familiar with, but do spend some time going over the code to see if you can get a high-level idea of what each is doing.
Reading code you didn’t write and making sense of unfamiliar ideas is something programmers do constantly — this is good practice.
You will notice that each of the provided functions has corresponding assert tests, but some are commented with a “eyeball test” note. For these functions, there is no way to easily test the function with an assertion, so in order to test it, one would need to visually inspect the result to verify correctness. These tests are commented out by default, but if you are interested, feel free to uncomment them to see what happens.
2.6. Part 3 — Check if a City is Infected
As discussed above, each city is represented as a list of three elements — the name of the city, the infection status of the city, and a list of neighbours the city is connected to.
Write a function is_infected that checks if a given city is infected or not. This function will take a city (list)
as a parameter and return True if the city is infected, and False otherwise.
2.7. Part 4 — Get a City’s Neighbours
Write a function get_neighbours that retrieves the neighbours of a given city. The function will take a city (list)
as a parameter and return a list containing all the neighbouring cities.
2.8. Part 5 — Infecting and Curing a City
Write functions to infect a city and cure a city. For infect, your function will take a city as a parameter
and return a copy of the city with the infection status set to True. Similarly for cure, the function will
take the city being cured as a parameter and will return a copy of the city with the infection status set to
False.
The simplest way to make a copy is to make a new city based on the information of the city being infected/cured and then setting the city’s infection status accordingly.
The motivation for making a copy and not just modifying the current city’s infection status value is to make our data immutable. By doing so, it keeps things easier to reason about and helps eliminate many potential problems within your programs.
2.9. Part 6 — How Many Cities are Infected
Write a function number_of_cities_infected that takes a world (list of cities) as a parameter and counts the number
of cities within the world that are infected. This function will return the final count when it completes. In other
words, it will look at each city within the world, check if it is infected, and if it is, it adds one to the running
total of infected cities. After each city has been investigated, the function returns the value of the running total of
infected cities.
Write another function, is_world_completely_infected, that takes a world (list of cities) as a parameter and returns
True if the whole world is infected (all cities are infected), and False otherwise. In other words,
if the number of cities infected is equal to the number of cities in the world, then the whole world is considered
infected.
2.10. Part 7 — Simulation Step
Write a function simulation_step that simulates a single iteration of the zombie apocalypse. The function will take
the world (list of cities) as a parameter, along with spread and cure probabilities as parameters. The function will
return a copy of the world after performing a step of the simulation.
The parameter spread_probability is a floating point value between 0 – 1 representing the percent probability that
a given infected city will spread the disease to one of its neighbours in the current simulation step. The parameter
cure_probability is the percent probability that a given infected city will cure itself in the current simulation
step.
The overall idea of simulating a step requires that each city in the world is investigated and checked if it will spread the disease to a neighbouring city and/or cure itself. Details are provided below and, given the complexity of this function, pseudocode is provided at the end of this section to help with the writing of your function.
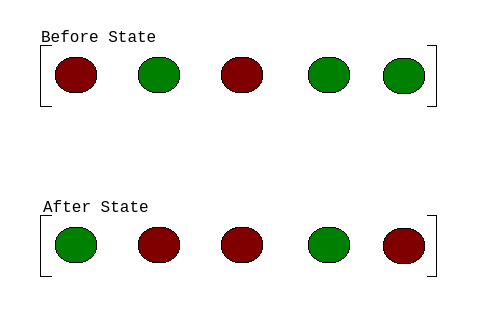
To perform a simulation step properly, one must consider that the world has a before state, which is the state of the
world before the simulation step occurs, and an after state, which is the state of the world after the simulation
step. To do this easily, a copy of the before state can be made (see the provided copy_world function) such that
your program has two versions of the world for the execution of the step of the simulation. Information for the
simulation step is retrieved from the before state, and all changes to the world will be put into the after state.
Consider the below image as an example. In the before state, cities 0 and 2 are infected, and cities 1, 3, and 4 are not infected. If during the simulation step city 0 were to become cured, and cities 1 and 4 become infected, the changes are made to the after state while the before state is left alone, unchanged. Again, note that before state and after state are two separate worlds (two separate lists of cities).
The simulation of a step requires checking if a city will either spread the disease or cure itself. This is where the
spread_probability and cure_probability values come in. These parameters will have some value between 0 – 1
— the closer to 0, the less likely we want the event is to occur, and the closer to 1, the more likely. To achieve
this functionality, we can make use of Python’s random library, namely, the
random function . This function will return some value
between 0 and 1 from a uniform distribution. Therefore, calling this function will provide some arbitrary value between
0 – 1, and by checking if that value is, for example < cure_probability, we can implement the probabilistic
occurrences of the events we want. For example, if cure_probability was set to 0.80 (80%), and since
random is equally likely to select all values between 0 – 1, random will produce a value less than 0.80
80% of the time.
When it comes to randomly selecting a neighbour to infect, the random library provides many functions that may work
effectively. The
choice function is worth investigating.
Finally, for the purposes of our simulation, we want to make sure city 0 is always infected. There are a few ways one could implement this, but perhaps the simplest is to update city 0 to infected in the after state before the function finishes. That way, if city 0 was cured during the simulation step, it is reset to infected.
Make a copy of the world for the after state
For each city in the before state:
    If the city is infected
        If the city is infecting a neighbouring city based on the probability value
            Select a random neighbour
            Infect the selected neighbour in the after state
        If the city is curing itself based on the probability value
            Cure the city in the after state
Ensure city 0 is always infected
Return after state
2.11. Part 8 — Simulate Infectious Disease Scenario
Write a function simulate_infectious_disease that simulates a full infectious disease scenario. The function will
have a world (list of cities) and the spread and cure probabilities as parameters. The function also has an optional
parameter for setting a cutoff for the simulation (more on this below). The function will return a list of the number of
cities infected at each step of the simulation.
The purpose of this function is to run the simulation step repeatedly until it is the end of the world (all cities
infected). In other words, loop the simulation step while the world is not completely infected. This will require the
use of simulation_step and is_world_completely_infected. Remember, the function simulation_step takes the
before state of the world as an argument and returns the after state — be sure to be keeping track of the most recent
world state in your loop.
The total number of cities infected at each step of the simulation is to be recorded and returned after the whole
simulation is complete. These values can simply be stored in a list, and after each step of the simulation the current
number of cities infected can be appended to the list. For this, make use of the number_of_cities_infected function.
Before the simulation starts looping through steps, city 0 needs to be set to infected, and the number of cities at time step 0 needs to be recorded in the list too. This means that the function should start with some simple setup work.
Lastly, there is a special optional cutoff parameter for the function. Since it is possible that the spread and cure
probabilities are set such that the loop may run excessively long, the cutoff value is used to ensure that the
simulation will stop in some reasonable time. Since a list is used to keep track of the number of infected cities after
each simulation step, the length of that list can be used to know how many times the loop ran (since the list grows by 1
every time the loop runs). In other words, a way to check how many times the loop has run would be
len(infected_count) < cutoff + 1, where infected_count is the list of the number of infected cities at each time
step. Note the use of the + 1 on cutoff, which is there since the list should start the loop with size 1 since
we include the number of cities infected before the simulation starts (which is just city 0 being infected).
Below is some pseudocode to help with writing the function.
Create empty list to keep track of the number of infected cities at each time step
Infect city 0
Update list of number of infected cities
While it is not the end of the world and we are not beyond the cutoff
    Run a simulation step
    Count the number of cities currently infected and update the list of the number of infected cities
Return the list of the number of infected cities at each step of the simulation
2.12. Part 9 — Using Your Code and Plotting
Call the simulate_infectious_disease function a few times and make use of the provided
draw_number_of_cities_infected function to visualize the results. Be sure to try varying parameter values,
especially for the spread and cure probabilities.
Typically, when analyzing a stochastic simulation of something, we run the simulation many times in order to get an idea
of how things work in general. Run the full simulation 100 times and, in a list, keep track of the number of
iterations each of the 100 simulations took to finish (remember, the simulate_infectious_disease returns a list
whose length minus one would be the number of steps the simulation took). Visualize the distribution of steps of the
infections disease scenario with the provided draw_distribution function. Like before, be sure to try varying values
for the spread and cure probabilities.
Make a world
Make an empty list to keep track of the length of each simulation
For some number of loops (100ish)
    Run a whole simulation
    Update the list of the lengths of simulations
After getting a sense of the results, do a short writeup in a txt/word file explaining your results. Also save some of the relevant figures (plots) to reference in your writeup. Questions to consider:
Fix the cure probability to zero. How does varying the spread probability affect the runtimes?
Fix the cure probability to
0.5. How does varying the spread probability affect the runtimes?Fix the spread probability to
0.5. How does varying the cure probability affect the runtimes?
Note, a single plot of the number of infected cities over a single run of the simulation is not too convincing. Showing the distribution of results over many simulations will provide a much more convincing argument.
2.13. Part 10 — Testing
To help ensure that your program is correct, run the provided assertion tests. Each function is followed by a series of
commented out assertion tests that will help you test your code. In addition to the assertion tests there are some
“eyeball tests” that require you to run and investigate yourself to confirm that the result looks correct. These tests
are needed due to the limitations of the assertion tests. When you are ready to test your functions, simply make them
not comments (remove the #) to include them in your running program. There is no guarantee that if your code passes
all the tests that you will be correct, but it certainly helps provide peace of mind that things are working as they
should.
Run the tests as you complete each part, not all at once at the end. One of the nice things about programming is that you can check your work as you go — you don’t have to wait for it to be marked to know if something is working.
2.14. Some Hints
Work on one function at a time
Get each function working perfectly before you go on to the next one
Test each function as you write it
This is a really nice thing about programming; you can call your functions and see what result gets returned
Mentally test before you even write — what does this function do? What problem is it solving?
If you need help, ask
Drop by office hours
2.15. Some Marking Details
Warning
Just because your program produces the correct output, that does not necessarily mean that you will get perfect, or even that your program is correct.
Below is a list of both quantitative and qualitative things we will look for:
Correctness?
Did you follow instructions?
Comments?
Variable Names?
Style?
Does the code make sense?
2.16. What to Submit to Moodle
Make sure your NAME and STUDENT NUMBER appear in a comment at the top of the program
Submit your version of
asn2.pyto MoodleDo not submit the .ipynb file
To get the
asn2.pyfile from Colab, see the example image in Assignment 1
A text/word file answering the analysis questions and providing data to back up your answers
Include images in your submission
Warning
Verify that your submission to Moodle worked. If you submit incorrectly, you will get a 0.
2.17. Assignment FAQ
My plots and figures look different every time I run the program, is that OK?
This is expected
The world configuration will be random every time
Whether a city spreads the infection is random
Which city the infection spreads to is random
When a city is cured is random
Why isn’t my drawing updating for each step?
Depending on your programming environment, this may be because it’s running so fast
Why does it seem that my program is running forever?
This could be because of a bug in your code
Could be the probabilities for spreading and curing are set in such a way that the simulation has yet to end
For example, with a high cure probability, it may be difficult for the infection to take over the whole world
Did I provide enough detail in my text file?
Probably
The shorter the better
The marker wants to see that you played around a little and found answers to the questions